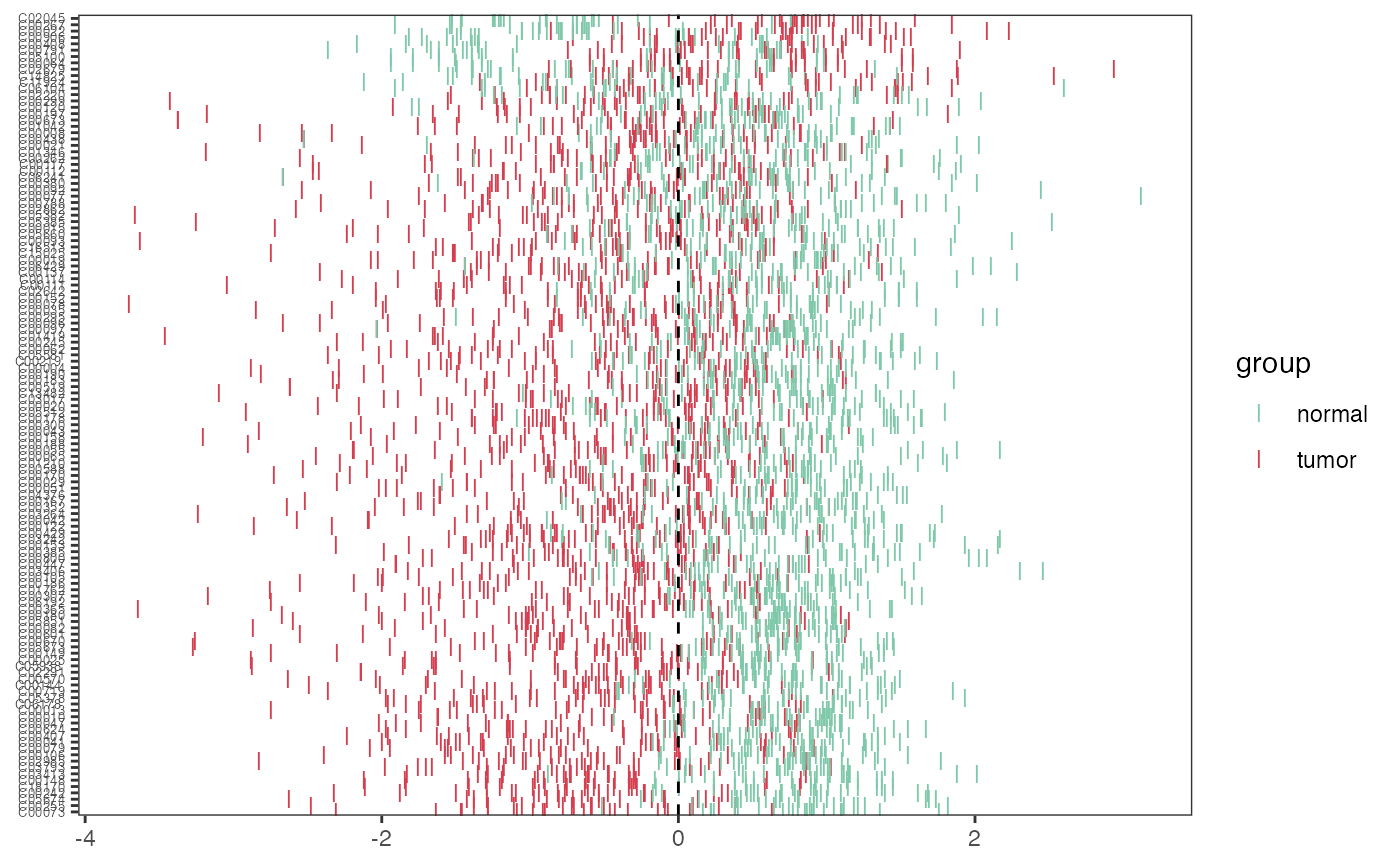
Visualization of the z-score plot
Usage
pZscore(
  object,
  group,
  tumor_color = "#d53e4f",
  normal_color = "#7FC8A9",
  shape_size = 3,
  ysize = 5
)
Arguments
- object
A dataframe-like data object containing raw metabolite intensity values, with rows corresponding to metabolites, and the columns corresponding to the samples
- group
the sample's group information
- tumor_color
the color of the tumor group
- normal_color
the color of the normal group
- shape_size
the size of the point shape
- ysize
the size of the y-axis text
Examples
library(dplyr)
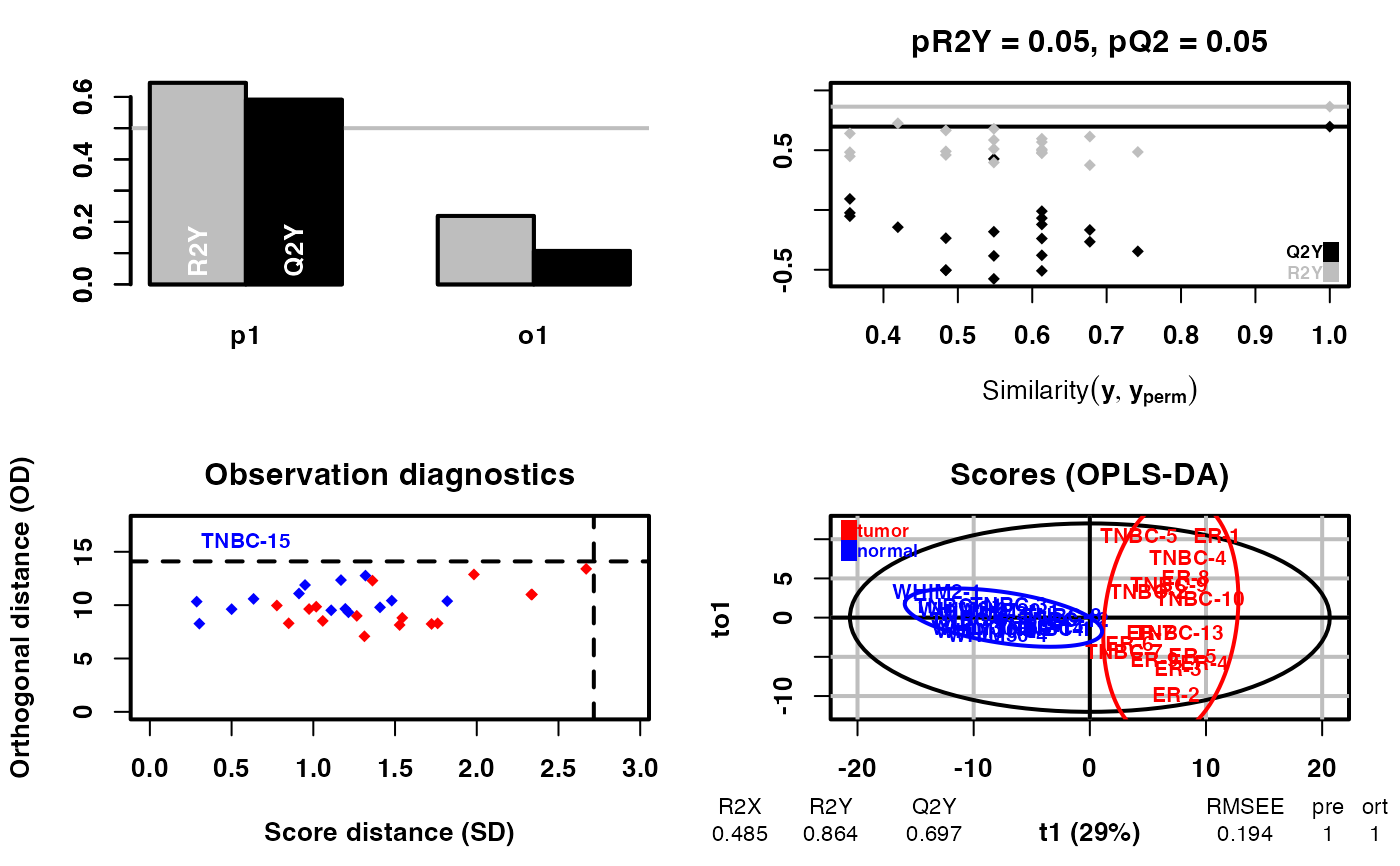
diff_result <- DM(2**meta_dat,group)
#> OPLS-DA
#> 31 samples x 219 variables and 1 response
#> standard scaling of predictors and response(s)
#> R2X(cum) R2Y(cum) Q2(cum) RMSEE pre ort pR2Y pQ2
#> Total 0.485 0.864 0.697 0.194 1 1 0.05 0.05
 # filter the differential metabolites by default fold change >1.5 or < 1/1.5 ,fdr < 0.05 and VIP>1
diff_result_filter <- diff_result %>%
dplyr::filter(Fold_change >1.3 | Fold_change < 1/1.3) %>%
dplyr::filter(Padj_wilcox<0.1) %>%
dplyr::filter(VIP>0.8)
meta_dat_diff <- meta_dat[rownames(meta_dat) %in% diff_result_filter$Name,]
p_zscore <- pZscore(meta_dat_diff,group)
p_zscore
# filter the differential metabolites by default fold change >1.5 or < 1/1.5 ,fdr < 0.05 and VIP>1
diff_result_filter <- diff_result %>%
dplyr::filter(Fold_change >1.3 | Fold_change < 1/1.3) %>%
dplyr::filter(Padj_wilcox<0.1) %>%
dplyr::filter(VIP>0.8)
meta_dat_diff <- meta_dat[rownames(meta_dat) %in% diff_result_filter$Name,]
p_zscore <- pZscore(meta_dat_diff,group)
p_zscore