Fold change, p value and vip of the data
Examples
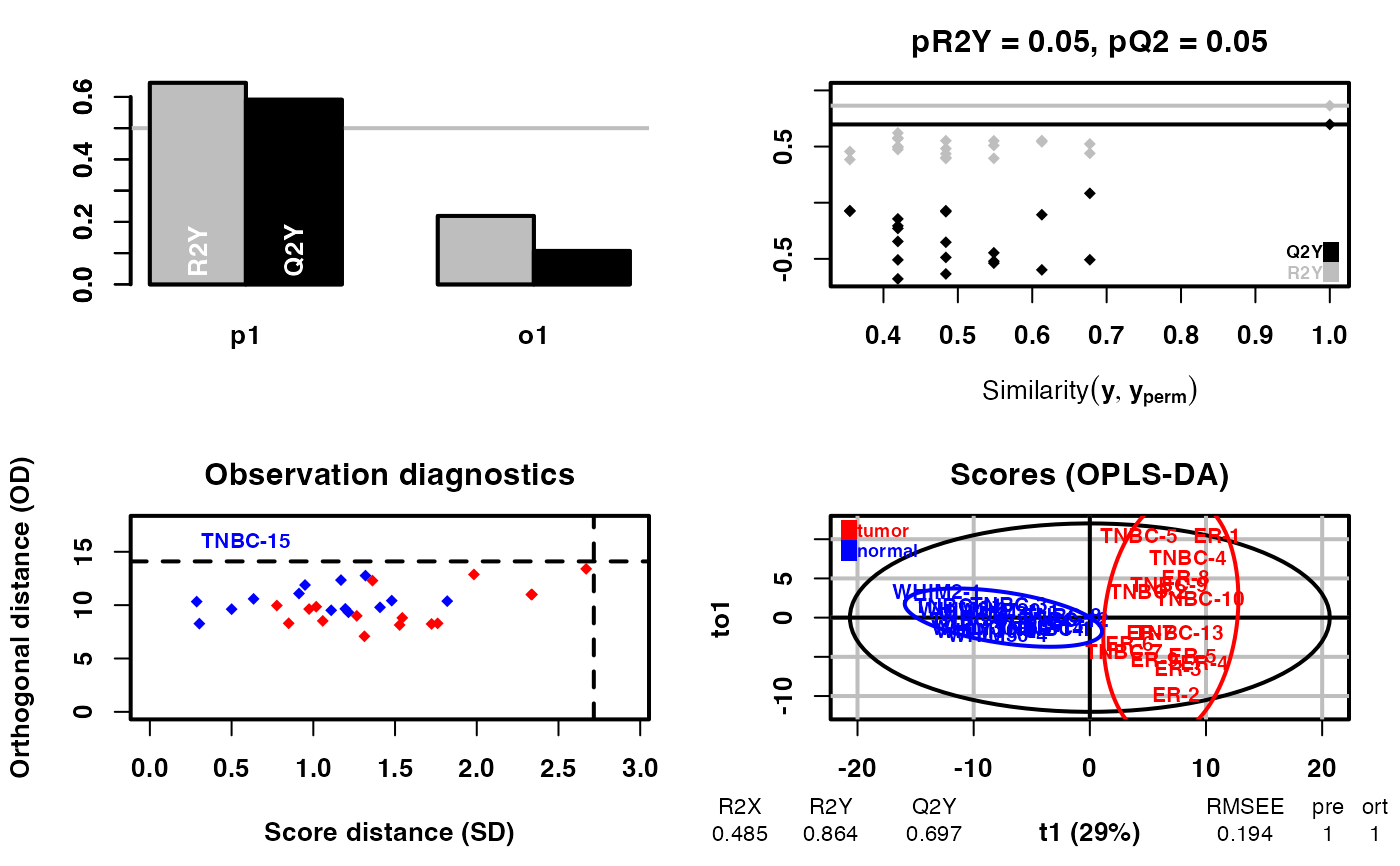
diff_result <- DM(2**meta_dat,group)
#> OPLS-DA
#> 31 samples x 219 variables and 1 response
#> standard scaling of predictors and response(s)
#>       R2X(cum) R2Y(cum) Q2(cum) RMSEE pre ort pR2Y  pQ2
#> Total    0.485    0.864   0.697 0.194   1   1 0.05 0.05

diff_result
#> # A tibble: 219 × 7
#>    Name    Fold_change  PValue_t   Padj_t PValue_wilcox Padj_wilcox    VIP
#>    <chr>         <dbl>     <dbl>    <dbl>         <dbl>       <dbl>  <dbl>
#>  1 C09642        0.842 0.168     0.221        0.173        0.224    0.520
#>  2 C05581        0.402 0.000793  0.00220      0.00192      0.00494  1.12
#>  3 C03264        0.434 0.0000617 0.000338     0.000187     0.000855 1.33
#>  4 C15025        0.683 0.00266   0.00614      0.00763      0.0165   0.995
#>  5 C00408        1.63  0.00688   0.0142       0.0187       0.0359   1.03
#>  6 C02918        0.497 0.677     0.734        0.0855       0.125    0.0628
#>  7 C06178        0.397 0.0000155 0.000121     0.0000839    0.000510 1.41
#>  8 C01250        0.326 0.0321    0.0524       0.0255       0.0454   0.695
#>  9 C02220        0.452 0.0403    0.0631       0.0552       0.0876   0.983
#> 10 C00881        0.300 0.0193    0.0343       0.0168       0.0328   0.796
#> # ℹ 209 more rows
diff_result
#> # A tibble: 219 × 7
#> Name Fold_change PValue_t Padj_t PValue_wilcox Padj_wilcox VIP
#> <chr> <dbl> <dbl> <dbl> <dbl> <dbl> <dbl>
#> 1 C09642 0.842 0.168 0.221 0.173 0.224 0.520
#> 2 C05581 0.402 0.000793 0.00220 0.00192 0.00494 1.12
#> 3 C03264 0.434 0.0000617 0.000338 0.000187 0.000855 1.33
#> 4 C15025 0.683 0.00266 0.00614 0.00763 0.0165 0.995
#> 5 C00408 1.63 0.00688 0.0142 0.0187 0.0359 1.03
#> 6 C02918 0.497 0.677 0.734 0.0855 0.125 0.0628
#> 7 C06178 0.397 0.0000155 0.000121 0.0000839 0.000510 1.41
#> 8 C01250 0.326 0.0321 0.0524 0.0255 0.0454 0.695
#> 9 C02220 0.452 0.0403 0.0631 0.0552 0.0876 0.983
#> 10 C00881 0.300 0.0193 0.0343 0.0168 0.0328 0.796
#> # ℹ 209 more rows