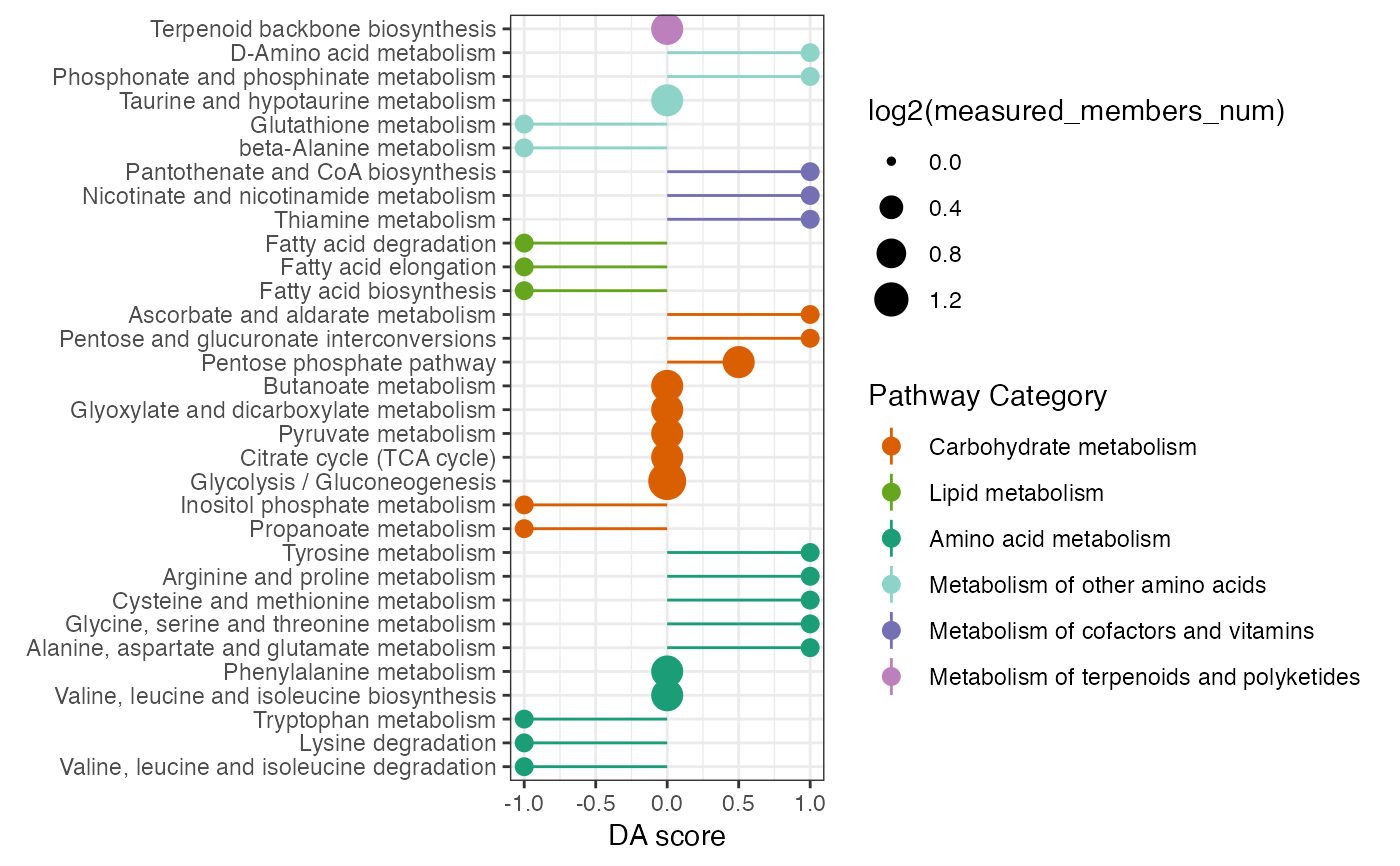
Calculate the differential abundance (DA) score and visualization the DA score
Usage
DAscore(
  increase_members,
  decrease_members,
  all_members,
  sort_plot = NA,
  min_measured_num = 2,
  out = "metabolite"
)
Arguments
- increase_members
the increased gene symbols and (or) metabolites' kegg id
- decrease_members
the decreased gene symbols and (or) metabolites' kegg id
- all_members
the all measured gene symbols and (or) metabolites' kegg id
- sort_plot
the method of pathway rank in the plot,Default rank by DA score. if value is category, then rank by pathway category
- min_measured_num
the minimum measured members that be ploted in a pathway, Default the value is 2.
- out
the analysis type,default "metabolite", alternative is "gene" and "Extended"
Examples
name <- c("C00022","C00024","C00031","B4GALT2","AGPAT3","FHIT")
DAscore_result <- DAscore(c(name[1], name[4]),
                          name[2], name, min_measured_num = 0,
                          sort_plot = "category")

DAscore_result$result
#> # A tibble: 32 × 10
#>    Pathway                    DA_score Increase_members_num Decrease_members_num
#>    <chr>                         <dbl>                <int>                <int>
#>  1 Propanoate metabolism            -1                    0                    1
#>  2 Inositol phosphate metabo…       -1                    0                    1
#>  3 Fatty acid biosynthesis          -1                    0                    1
#>  4 Fatty acid elongation            -1                    0                    1
#>  5 Fatty acid degradation           -1                    0                    1
#>  6 Valine, leucine and isole…       -1                    0                    1
#>  7 Lysine degradation               -1                    0                    1
#>  8 Tryptophan metabolism            -1                    0                    1
#>  9 beta-Alanine metabolism          -1                    0                    1
#> 10 Glutathione metabolism           -1                    0                    1
#> # ℹ 22 more rows
#> # ℹ 6 more variables: Measured_members_num <int>, Increase_member_result <chr>,
#> #   Decrease_member_result <chr>, Measure_member_result <chr>,
#> #   KEGG_pathwayid <chr>, `Pathway Category` <chr>
DAscore_result$p