4 Extended Pathway Analyses
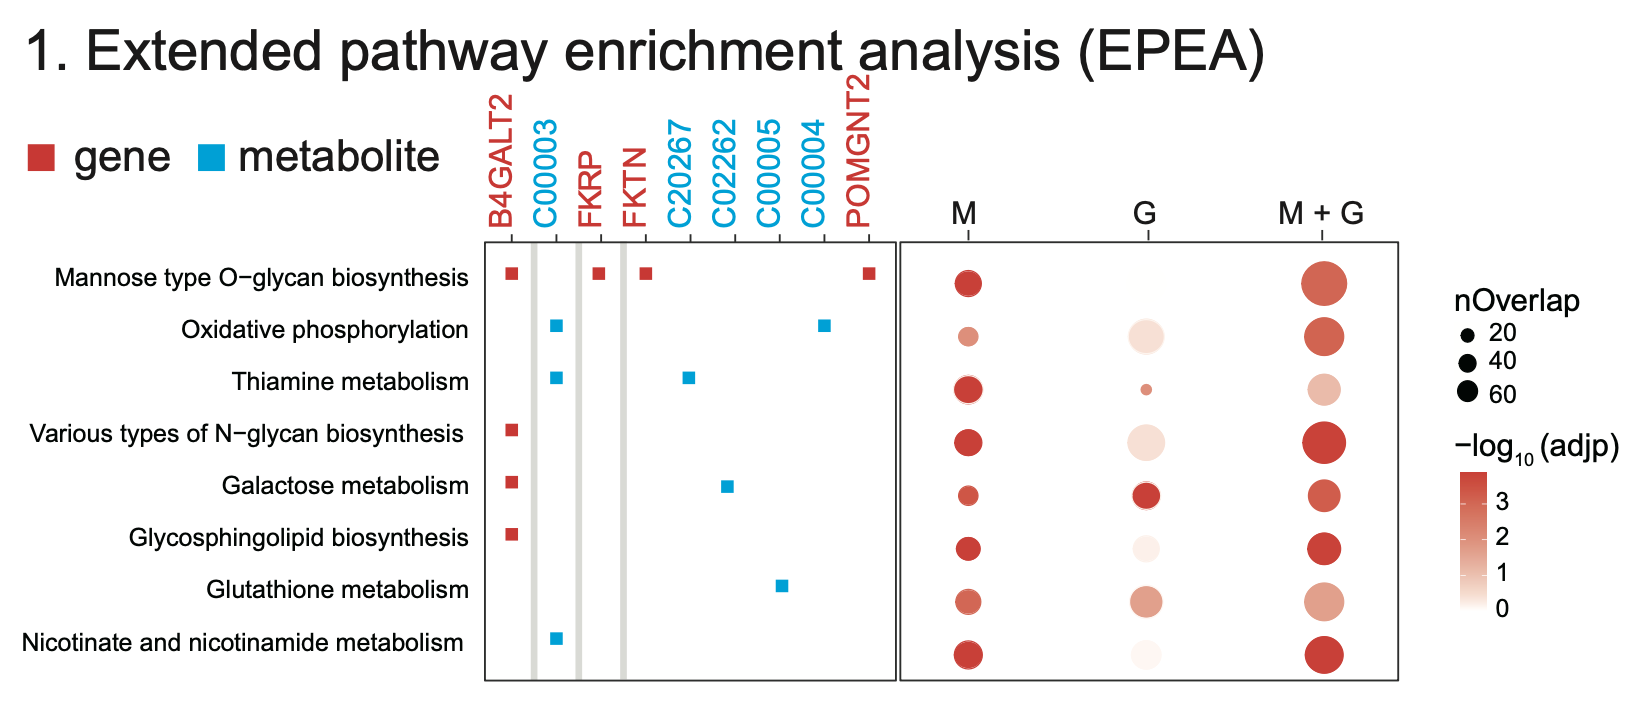
4.1 Extended pathway enrichment analysis (ePEA)
Procedure
-
Step 1: Enter Metabolite Data, GeneExp Data and Group Data, respectively.
-
Step 2: Select Log(FoldChange), Padjust Cutoff and Pathway Pcutoff, respectively.
-
Fold change: Identifies key metabolites with significant expression shifts between conditions, revealing potential metabolic alterations and pathway involvement in biological processes.
-
Padjust Cutoff: Helps filter significant results by controlling for false positives, ensuring that only statistically robust pathways are identified for further investigation.
-
Pathway Pcutoff: Sets a significance threshold, helping to identify pathways with meaningful changes while reducing the likelihood of false-positive findings.
-
-
Step 3: Select Figure Format and adjust figure width, height and DPI.
-
Step 4: click Figure Download to export analysis result.
Results
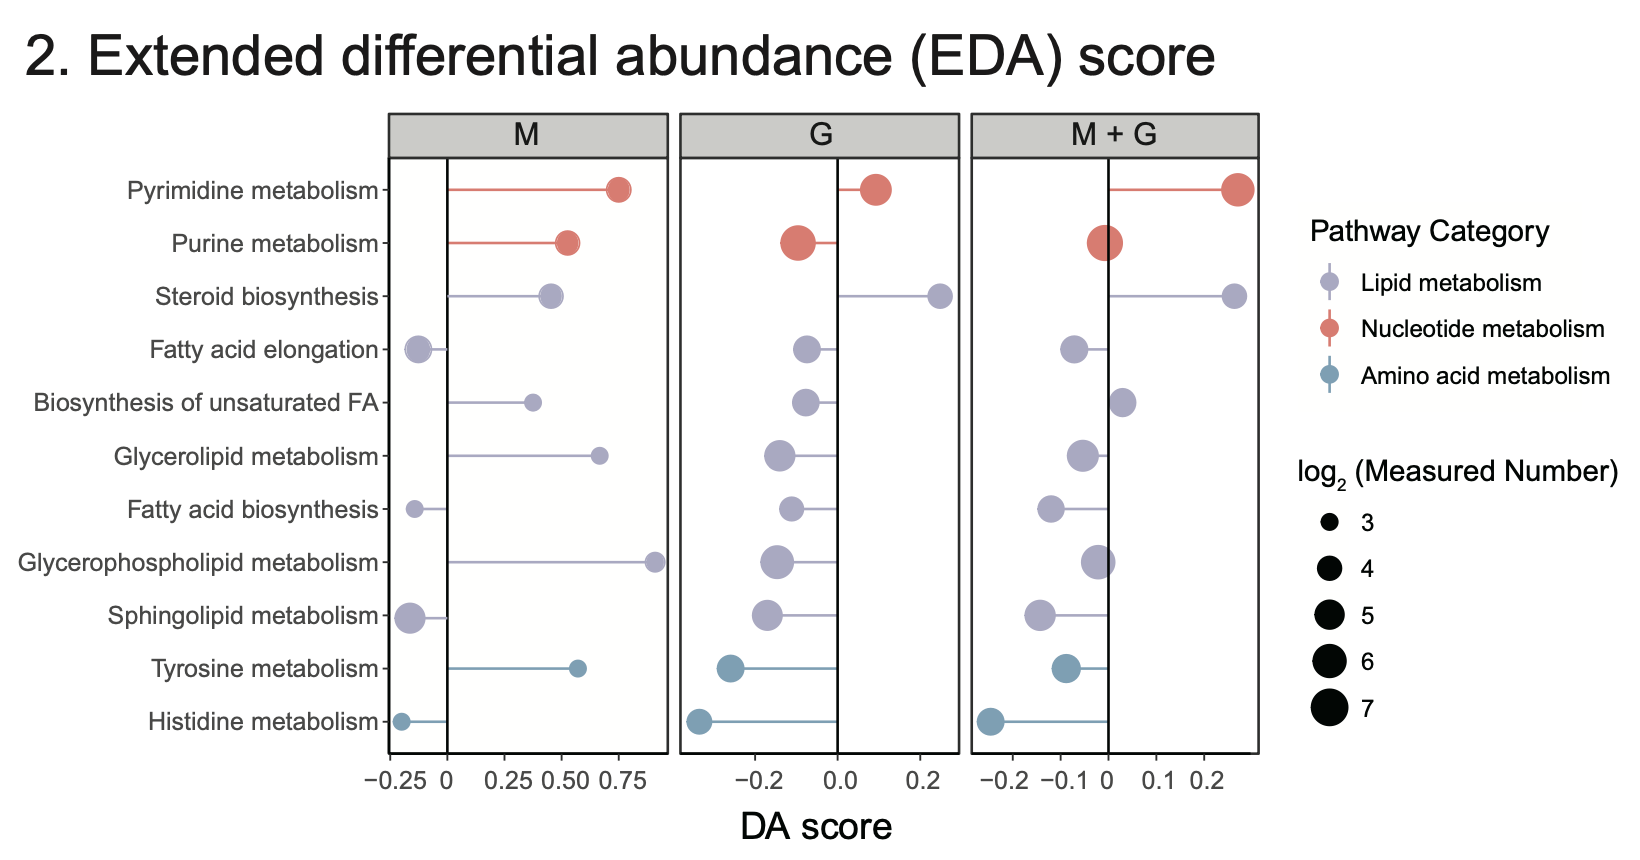
4.2 Extended differential abundance (EDA) score
Procedure
-
Step 1: Enter Metabolite Data, GeneExp Data and Group Data, respectively.
-
Step 2: Select Log(FoldChange), Padjust Cutoff and Pathway Pcutoff, respectively.
-
Fold change: Identifies key metabolites with significant expression shifts between conditions, revealing potential metabolic alterations and pathway involvement in biological processes.
-
Padjust Cutoff: Helps filter significant results by controlling for false positives, ensuring that only statistically robust pathways are identified for further investigation.
-
Pathway Pcutoff: Sets a significance threshold, helping to identify pathways with meaningful changes while reducing the likelihood of false-positive findings.
-
-
Step 3: Select Figure Format and adjust figure width, height and DPI.
-
Step 4: click Figure Download to export analysis result.
Results
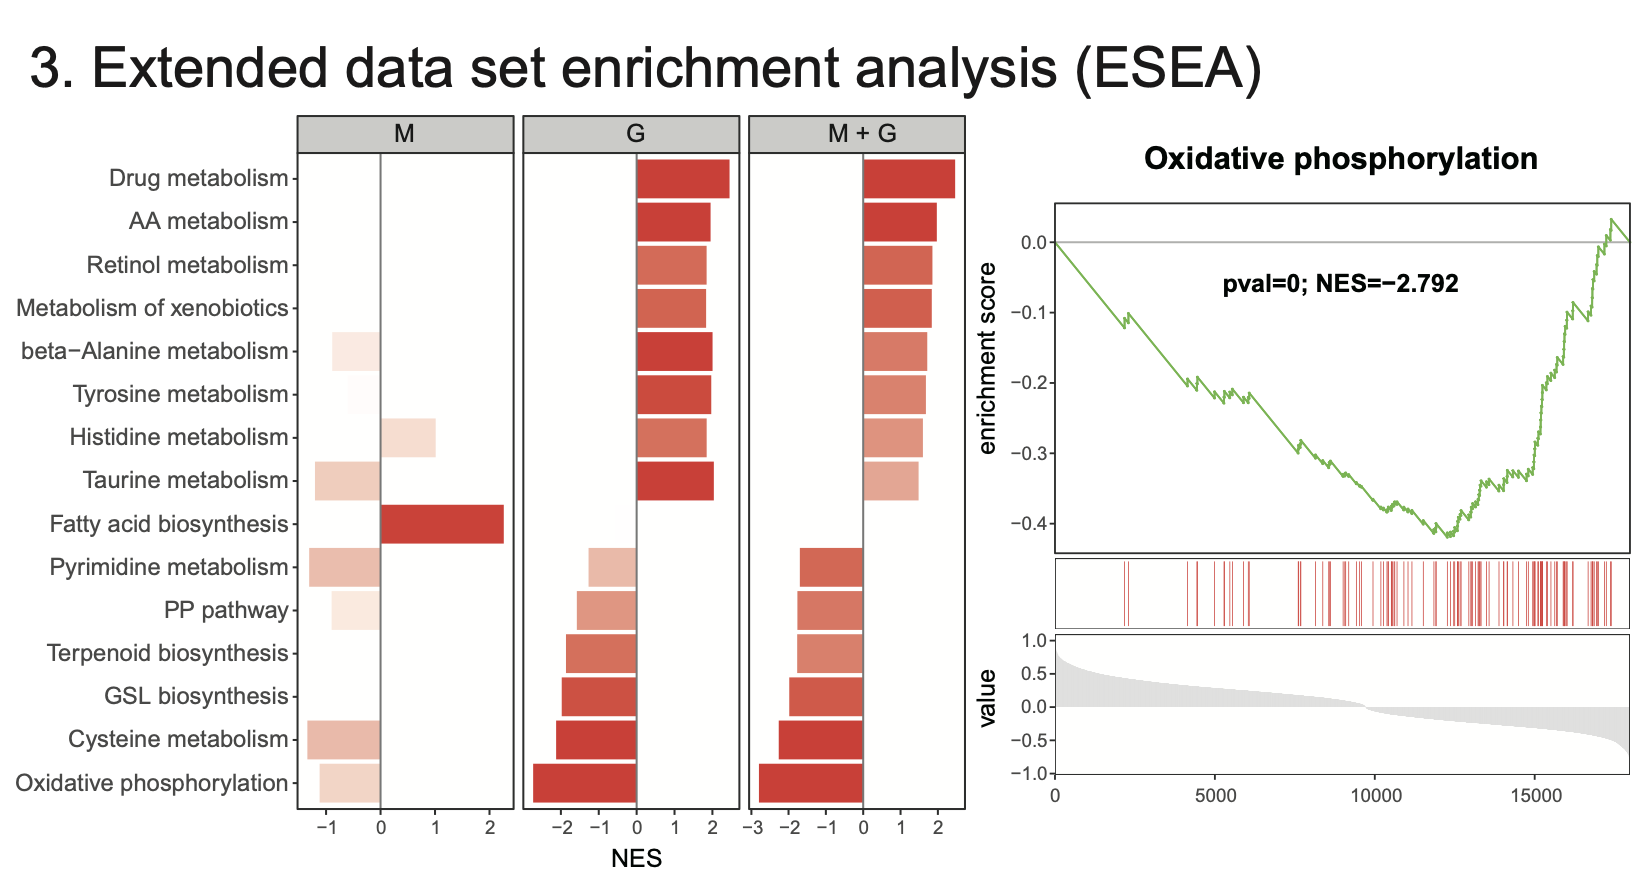
4.3 Extended data set enrichment analysis (ESEA)
Procedure
-
Step 1: Enter Metabolite Data, GeneExp Data and Group Data, respectively.
-
Step 2: Select Log(FoldChange), Padjust Cutoff and Pathway Pcutoff, respectively.
-
Fold change: Identifies key metabolites with significant expression shifts between conditions, revealing potential metabolic alterations and pathway involvement in biological processes.
-
Padjust Cutoff: Helps filter significant results by controlling for false positives, ensuring that only statistically robust pathways are identified for further investigation.
-
Pathway Pcutoff: Sets a significance threshold, helping to identify pathways with meaningful changes while reducing the likelihood of false-positive findings.
-
-
Step 3: Select Figure Format and adjust figure width, height and DPI.
-
Step 4: click Figure Download to export analysis result.
Results