Chapter 4 Example-rountine analyses
4.1 Metabolite and kegg name change
4.1.1 Metabolite name changed to refmet name
This step requires networking.
RefMet: A Reference list of Metabolite names.
The main objective of RefMet is to provide a standardized reference nomenclature for both discrete metabolite structures and metabolite species identified by spectroscopic techniques in metabolomics experiments.
compound_name <- c("2-Hydroxybutyric acid","1-Methyladenosine","tt","2-Aminooctanoic acid")
refmetid_result <- name2refmet(compound_name)
write.table(refmetid_result,"result/routine/01.refmetid_result.txt",quote=F,sep="\t",row.names=F)
## Input_name Refmet_name Formula Super_class
## 1 2-Hydroxybutyric acid 2-Hydroxybutyric acid C4H8O3 Fatty Acyls
## 2 1-Methyladenosine 1-Methyladenosine C11H15N5O4 Nucleic acids
## 3 tt tt <NA> <NA>
## 4 2-Aminooctanoic acid 2-Aminocaprylic acid C8H17NO2 Fatty Acyls
## Main_class Sub_class
## 1 Fatty acids Hydroxy FA
## 2 Purines Purine ribonucleosides
## 3 <NA> <NA>
## 4 Fatty acids Amino FA4.1.2 Metabolite name changed to kegg id
This step requires networking.
Search the KEGG ID corresponding to the metabolites name.
compound_name <- c("2-Hydroxybutyric acid","1-Methyladenosine","tt","2-Aminooctanoic acid")
keggid_result <- name2keggid(compound_name) %>%
  tidyr::separate_rows(KEGG_id,sep=";") %>%
  tibble::as_tibble()

write.table(keggid_result,"result/routine/02.keggid_result.txt",quote=F,sep="\t",row.names=F)
## Name KEGG_id
## 1 2-Hydroxybutyric acid C05984
## 2 1-Methyladenosine C02494
## 3 tt <NA>
## 4 2-Aminooctanoic acid <NA>4.1.3 Metabolite name corresponding to kegg pathway
This step requires networking.
Search the KEGG pathway corresponding to the metabolite name.
compound_name <- c("2-Hydroxybutyric acid","1-Methyladenosine","tt","2-Aminooctanoic acid")
result_all <- name2pathway(compound_name)

##### the output is the each metabolite related pathway
result_name2pathway <- result_all$name2pathway
write.table(result_name2pathway,"result/routine/03.name2pathway_keggpathway.txt",quote=F,sep="\t",row.names=F)
result_name2keggid <- result_all$kegg_id
write.table(result_name2keggid,"result/routine/03.name2pathway_keggid.txt",quote=F,sep="\t",row.names=F)
result_name2enrichpathway <- result_all$pathway
write.table(result_name2enrichpathway,"result/routine/03.name2pathway_pathwayenrich.txt",quote=F,sep="\t",row.names=F)
## Name KEGG_id Pathway Pathway_category
## 1 2-Hydroxybutyric acid C05984 Propanoate metabolism Carbohydrate metabolism
## Pathway_id
## 1 hsa00640## Name KEGG_id
## 1 2-Hydroxybutyric acid C05984
## 2 1-Methyladenosine C02494
## 3 tt <NA>
## 4 2-Aminooctanoic acid <NA>## name nAnno nOverlap fc zscore pvalue adjp or CIl CIu
## 1 Propanoate metabolism 40 1 76.1 8.66 0 0 Inf 1.93 Inf
## distance namespace members_Overlap
## 1 1 Customised C05984
## members_Anno
## 1 C00024, C00042, C00068, C00083, C00091, C00099, C00100, C00109, C00111, C00163, C00186, C00222, C00424, C00479, C00546, C00583, C00683, C00804, C00827, C00894, C01013, C01213, C02170, C02225, C02335, C02876, C04225, C04593, C05235, C05668, C05979, C05983, C05984, C05989, C06002, C15972, C15973, C21017, C21018, C21250
## members_Overlap_name
## 1 2-Hydroxybutanoic acid
## members_Anno_name
## 1 Acetyl-CoA;Succinate;Thiamin diphosphate;Malonyl-CoA;Succinyl-CoA;beta-Alanine;Propanoyl-CoA;2-Oxobutanoate;Glycerone phosphate;Propanoate;(S)-Lactate;3-Oxopropanoate;(S)-Lactaldehyde;Propanal;Methylglyoxal;Propane-1,2-diol;(S)-Methylmalonyl-CoA;Propynoate;Lactoyl-CoA;Propenoyl-CoA;3-Hydroxypropanoate;(R)-Methylmalonyl-CoA;Methylmalonate;2-Methylcitrate;beta-Alanyl-CoA;Propanoyl phosphate;(Z)-But-2-ene-1,2,3-tricarboxylate;(2S,3R)-3-Hydroxybutane-1,2,3-tricarboxylate;Hydroxyacetone;3-Hydroxypropionyl-CoA;Propane-1-ol;Propionyladenylate;2-Hydroxybutanoic acid;3-Oxopropionyl-CoA;(S)-Methylmalonate semialdehyde;Enzyme N6-(lipoyl)lysine;Enzyme N6-(dihydrolipoyl)lysine;2-(alpha-Hydroxypropyl)thiamine diphosphate;Enzyme N6-(S-propyldihydrolipoyl)lysine;2-Methyl-trans-aconitate4.1.4 Metabolite keggid to kegg pathway
library(MNet)
keggid <- c("C05984","C02494")
##### the output is the each metabolite related pathway
keggpathway_result <- keggid2pathway(keggid)
head(keggpathway_result)
## # A tibble: 1 × 5
## ENTRY NAME PATHWAY pathway_type V2
## <chr> <chr> <chr> <chr> <chr>
## 1 C05984 2-Hydroxybutanoic acid;///2-Hydroxybutyrate… Propan… Carbohydrat… hsa0…4.1.5 The pathway information
result <- pathwayinfo("hsa00630")
result <- pathwayinfo("Glyoxylate and dicarboxylate metabolism")
result$gene_info[1:2,]
## type name kegg_pathwayid kegg_pathwayname
## 1 gene ACSS1 hsa00630 Glyoxylate and dicarboxylate metabolism
## 2 gene ACSS2 hsa00630 Glyoxylate and dicarboxylate metabolism
## kegg_category
## 1 Carbohydrate metabolism
## 2 Carbohydrate metabolism## type name kegg_pathwayid kegg_pathwayname
## 1 metabolite C00007 hsa00630 Glyoxylate and dicarboxylate metabolism
## 2 metabolite C00011 hsa00630 Glyoxylate and dicarboxylate metabolism
## kegg_category
## 1 Carbohydrate metabolism
## 2 Carbohydrate metabolism4.2 Group-wise analyses
4.2.1 PCA plot
PCA of the data.
### the pca plot
p_PCA <- pPCA(meta_dat,group)
ggsave("result/routine/04.PCA_1.pdf",p_PCA$p1,height = 6,width = 6)
ggsave("result/routine/04.PCA_2.pdf",p_PCA$p2,height = 6,width = 6)
ggsave("result/routine/04.PCA_3.pdf",p_PCA$p3,height = 10,width = 10)

ggsave("result/routine/04.PCA_1.png",p_PCA$p1,height = 6,width = 6)
ggsave("result/routine/04.PCA_2.png",p_PCA$p2,height = 6,width = 6)
ggsave("result/routine/04.PCA_3.png",p_PCA$p3,height = 10,width = 10)


4.2.2 Differnetial metabolite analysis
4.2.2.2 Using the function DM in R packages “MNet”
diff_result <- DM(2**meta_dat,group)
dev.off()
write.table(diff_result,"result/routine/05.DM_result.txt",quote=F,row.names=F,sep="\t")

## filter the differential metabolites by default fold change >1.5 or < 1/1.5 ,Padj_wilcox < 0.05 and VIP>1

diff_result_filter <- diff_result %>%
  dplyr::filter(Fold_change >1.3 | Fold_change < 1/1.3) %>%
  dplyr::filter(Padj_wilcox<0.1) %>%
  dplyr::filter(VIP>0.8)

utils::write.table(diff_result,"result/routine/05.all_TumorvsNormal.txt",quote=F,row.names=F,sep="\t")
utils::write.table(diff_result_filter,"result/routine/05.diff_TumorvsNormal.txt",quote=F,row.names=F,sep="\t")
4.2.3 Differential metabolites’ volcano
The volcano plot of metabolites using the function “pVolcano” in the package “MNet”.
p_volcano <- pVolcano(diff_result,foldchange=1.5)
#p_volcano
ggsave("result/routine/06.volcano.pdf",p_volcano,height = 3,width = 4)
ggsave("result/routine/06.volcano.png",p_volcano,height = 3,width = 4)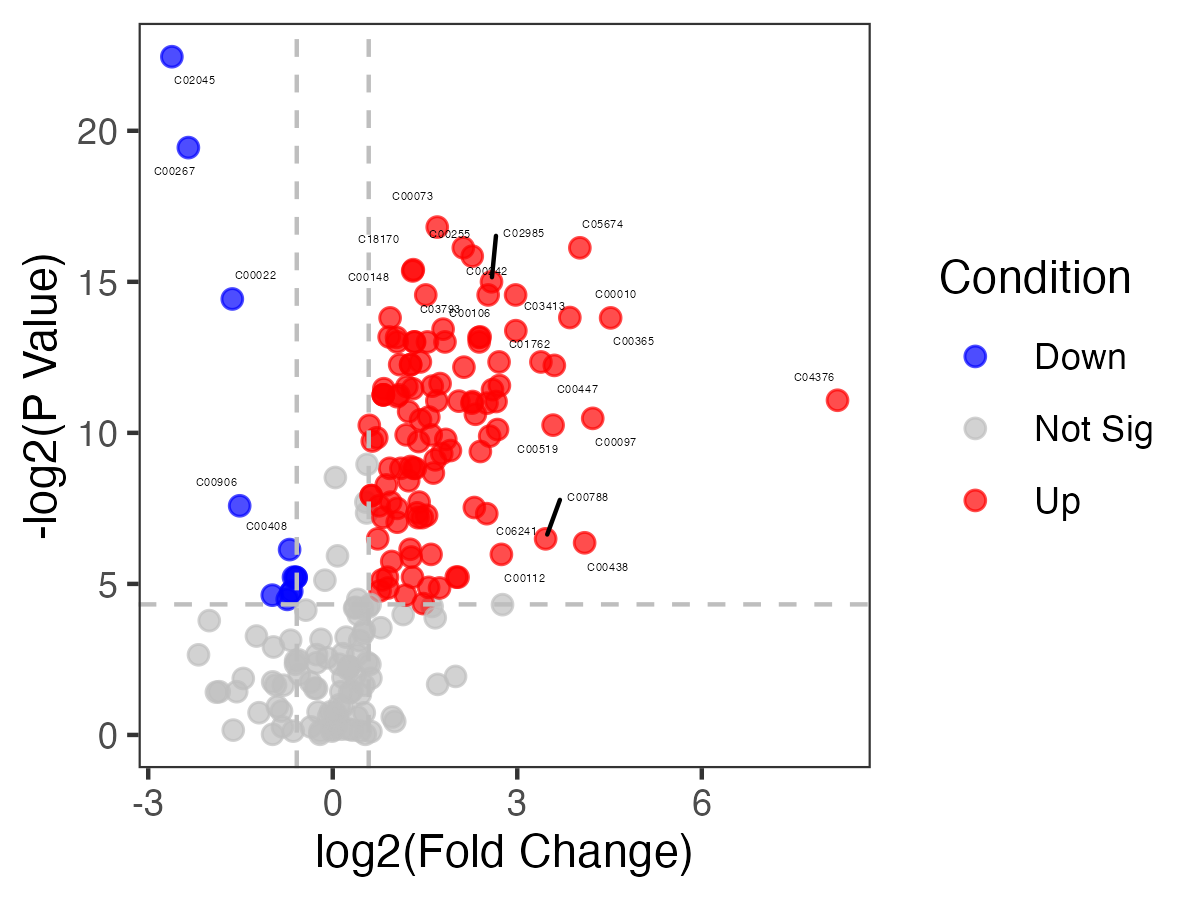
4.2.4 Differential metabolites’ heatmap
The heatmap plot of differentital metabolites using the function “pHeatmap” in R package “MNet”.
meta_dat_diff <- meta_dat[rownames(meta_dat) %in% diff_result_filter$Name,]
p_heatmap <- pHeatmap(meta_dat_diff,group,fontsize_row=5,fontsize_col=4,clustering_method="ward.D",clustering_distance_cols="correlation")
ggsave("result/routine/07.heatmap.pdf",p_heatmap,width=10,height=8)
ggsave("result/routine/07.heatmap.png",p_heatmap,width=10,height=8)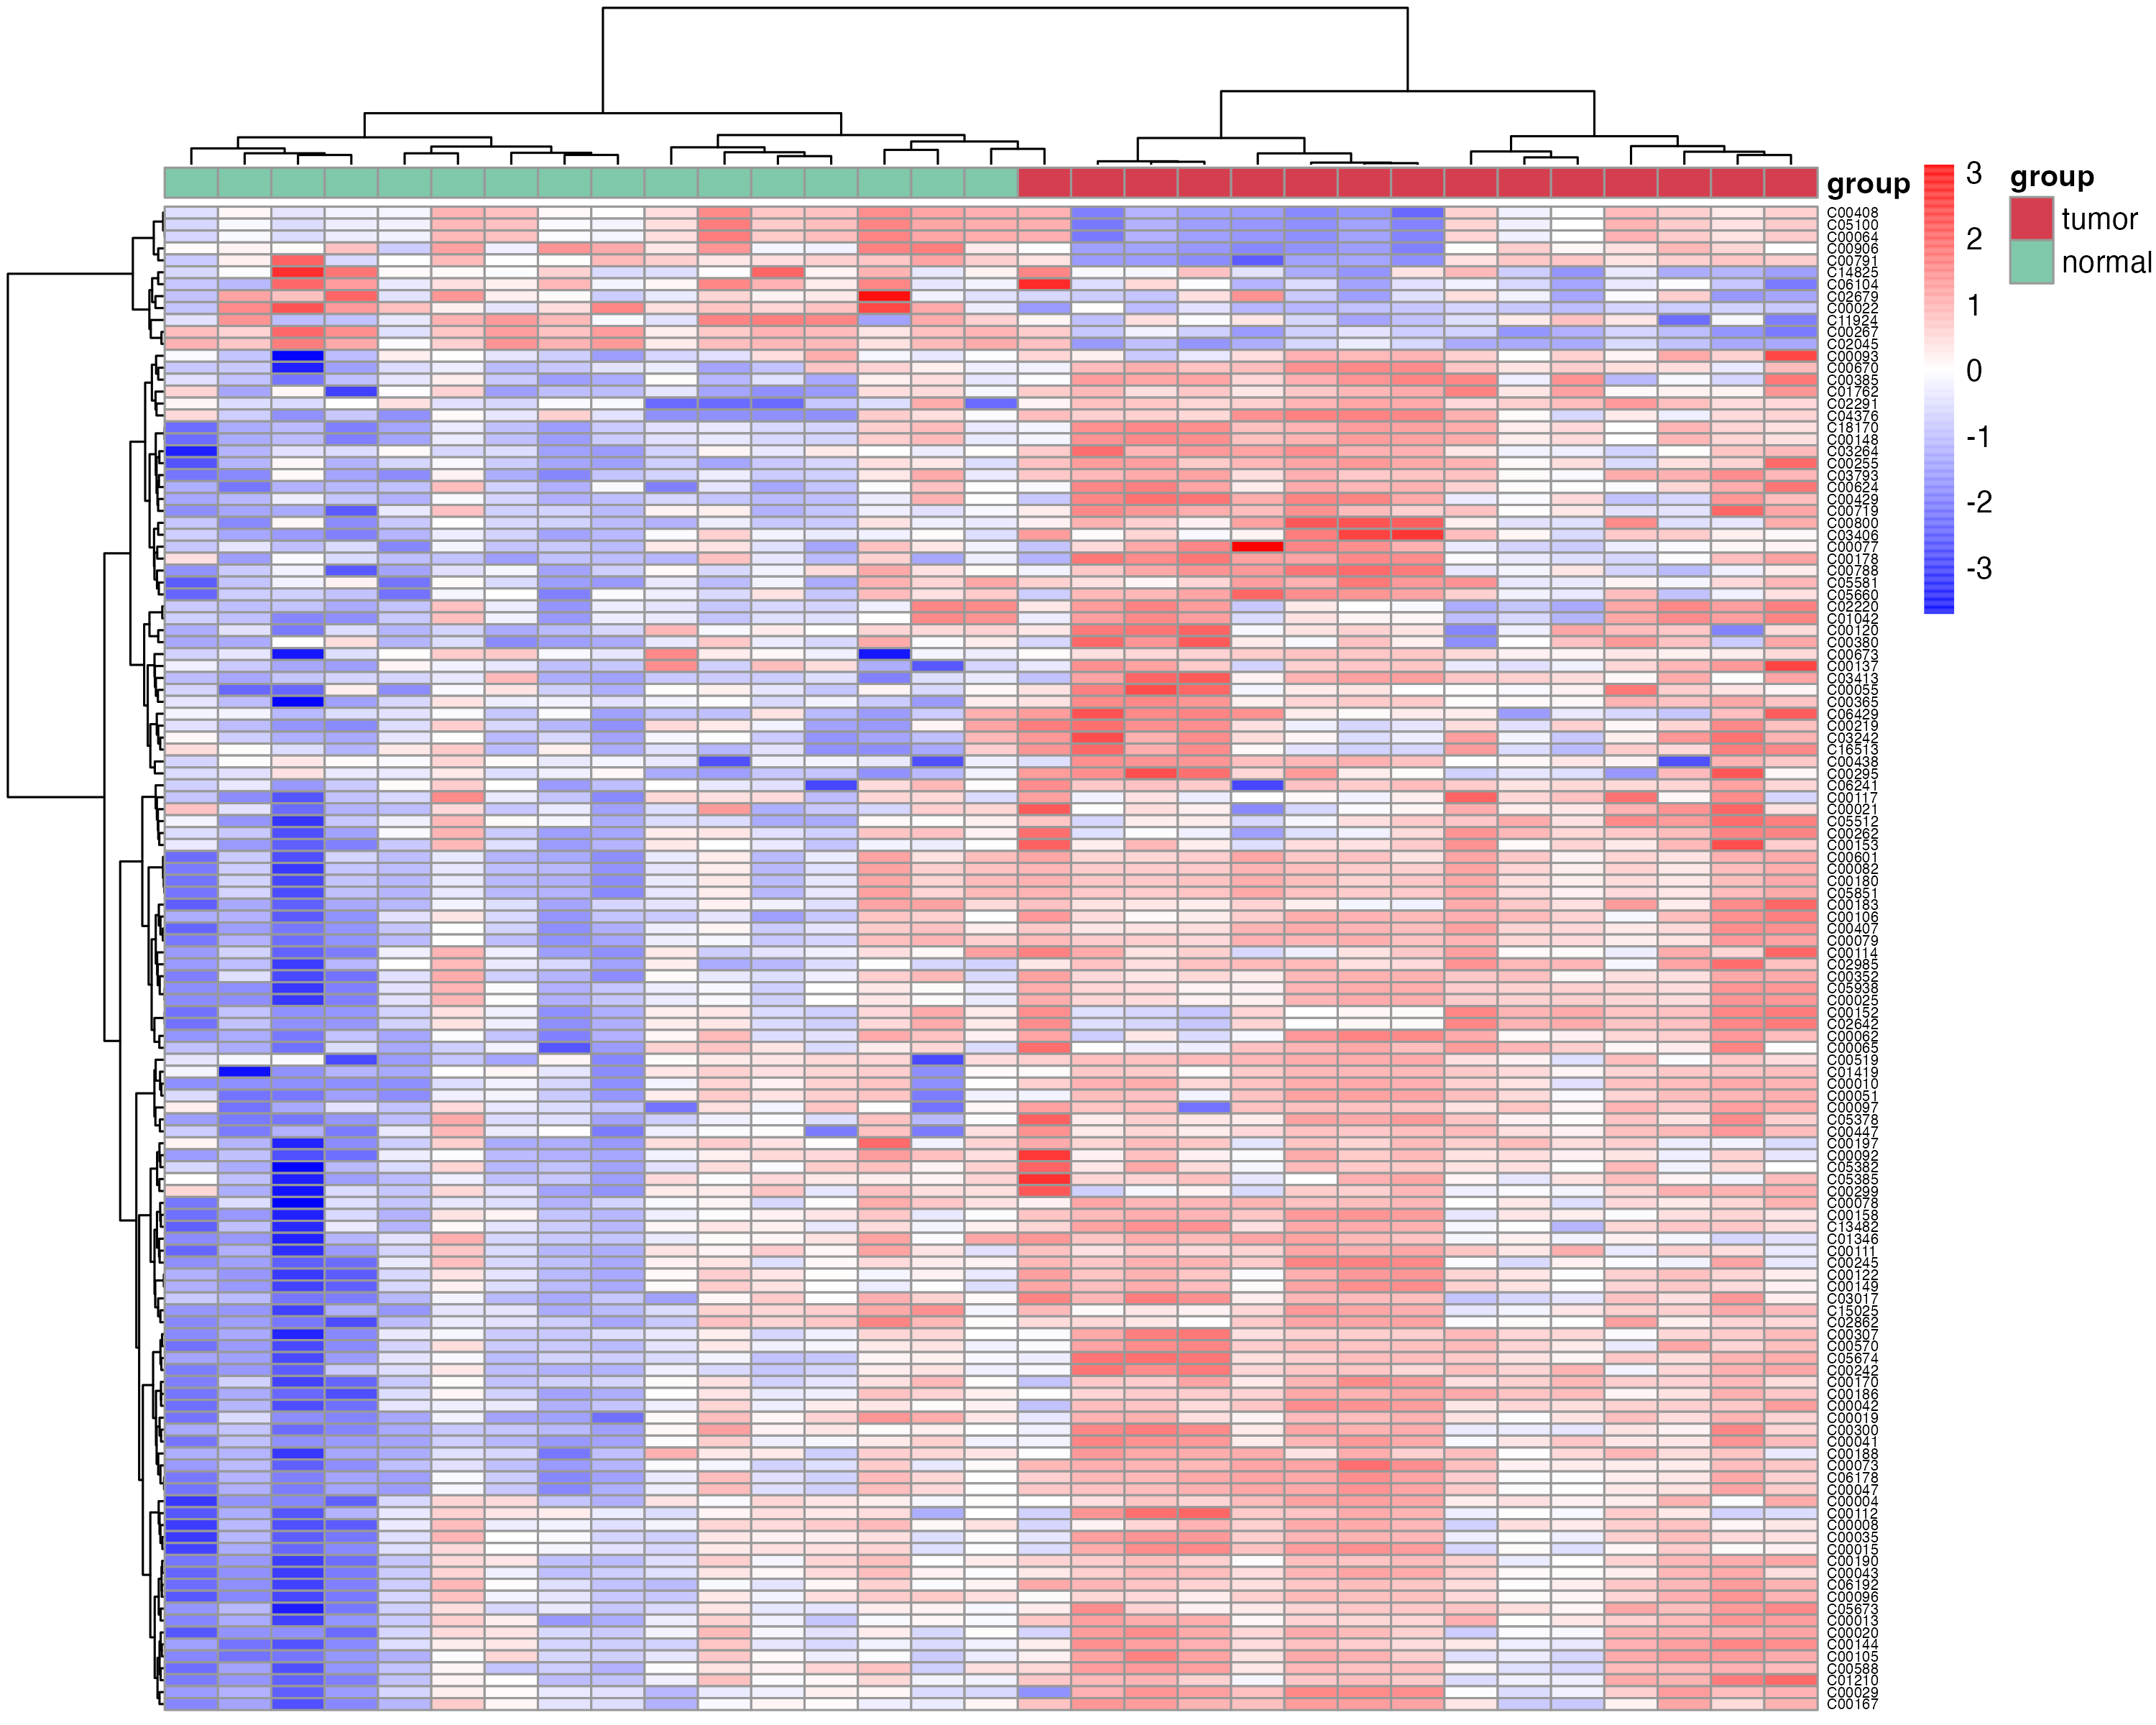
4.2.5 Differential metabolites’ zscore
The zscore plot of differentital metabolites using the function “pZscore” in R package “MNet”.
p_zscore <- pZscore(meta_dat_diff,group)
#p_zscore
ggsave("result/routine/08.z_score.pdf",p_zscore,width=6,height=8)
ggsave("result/routine/08.z_score.png",p_zscore,width=6,height=8)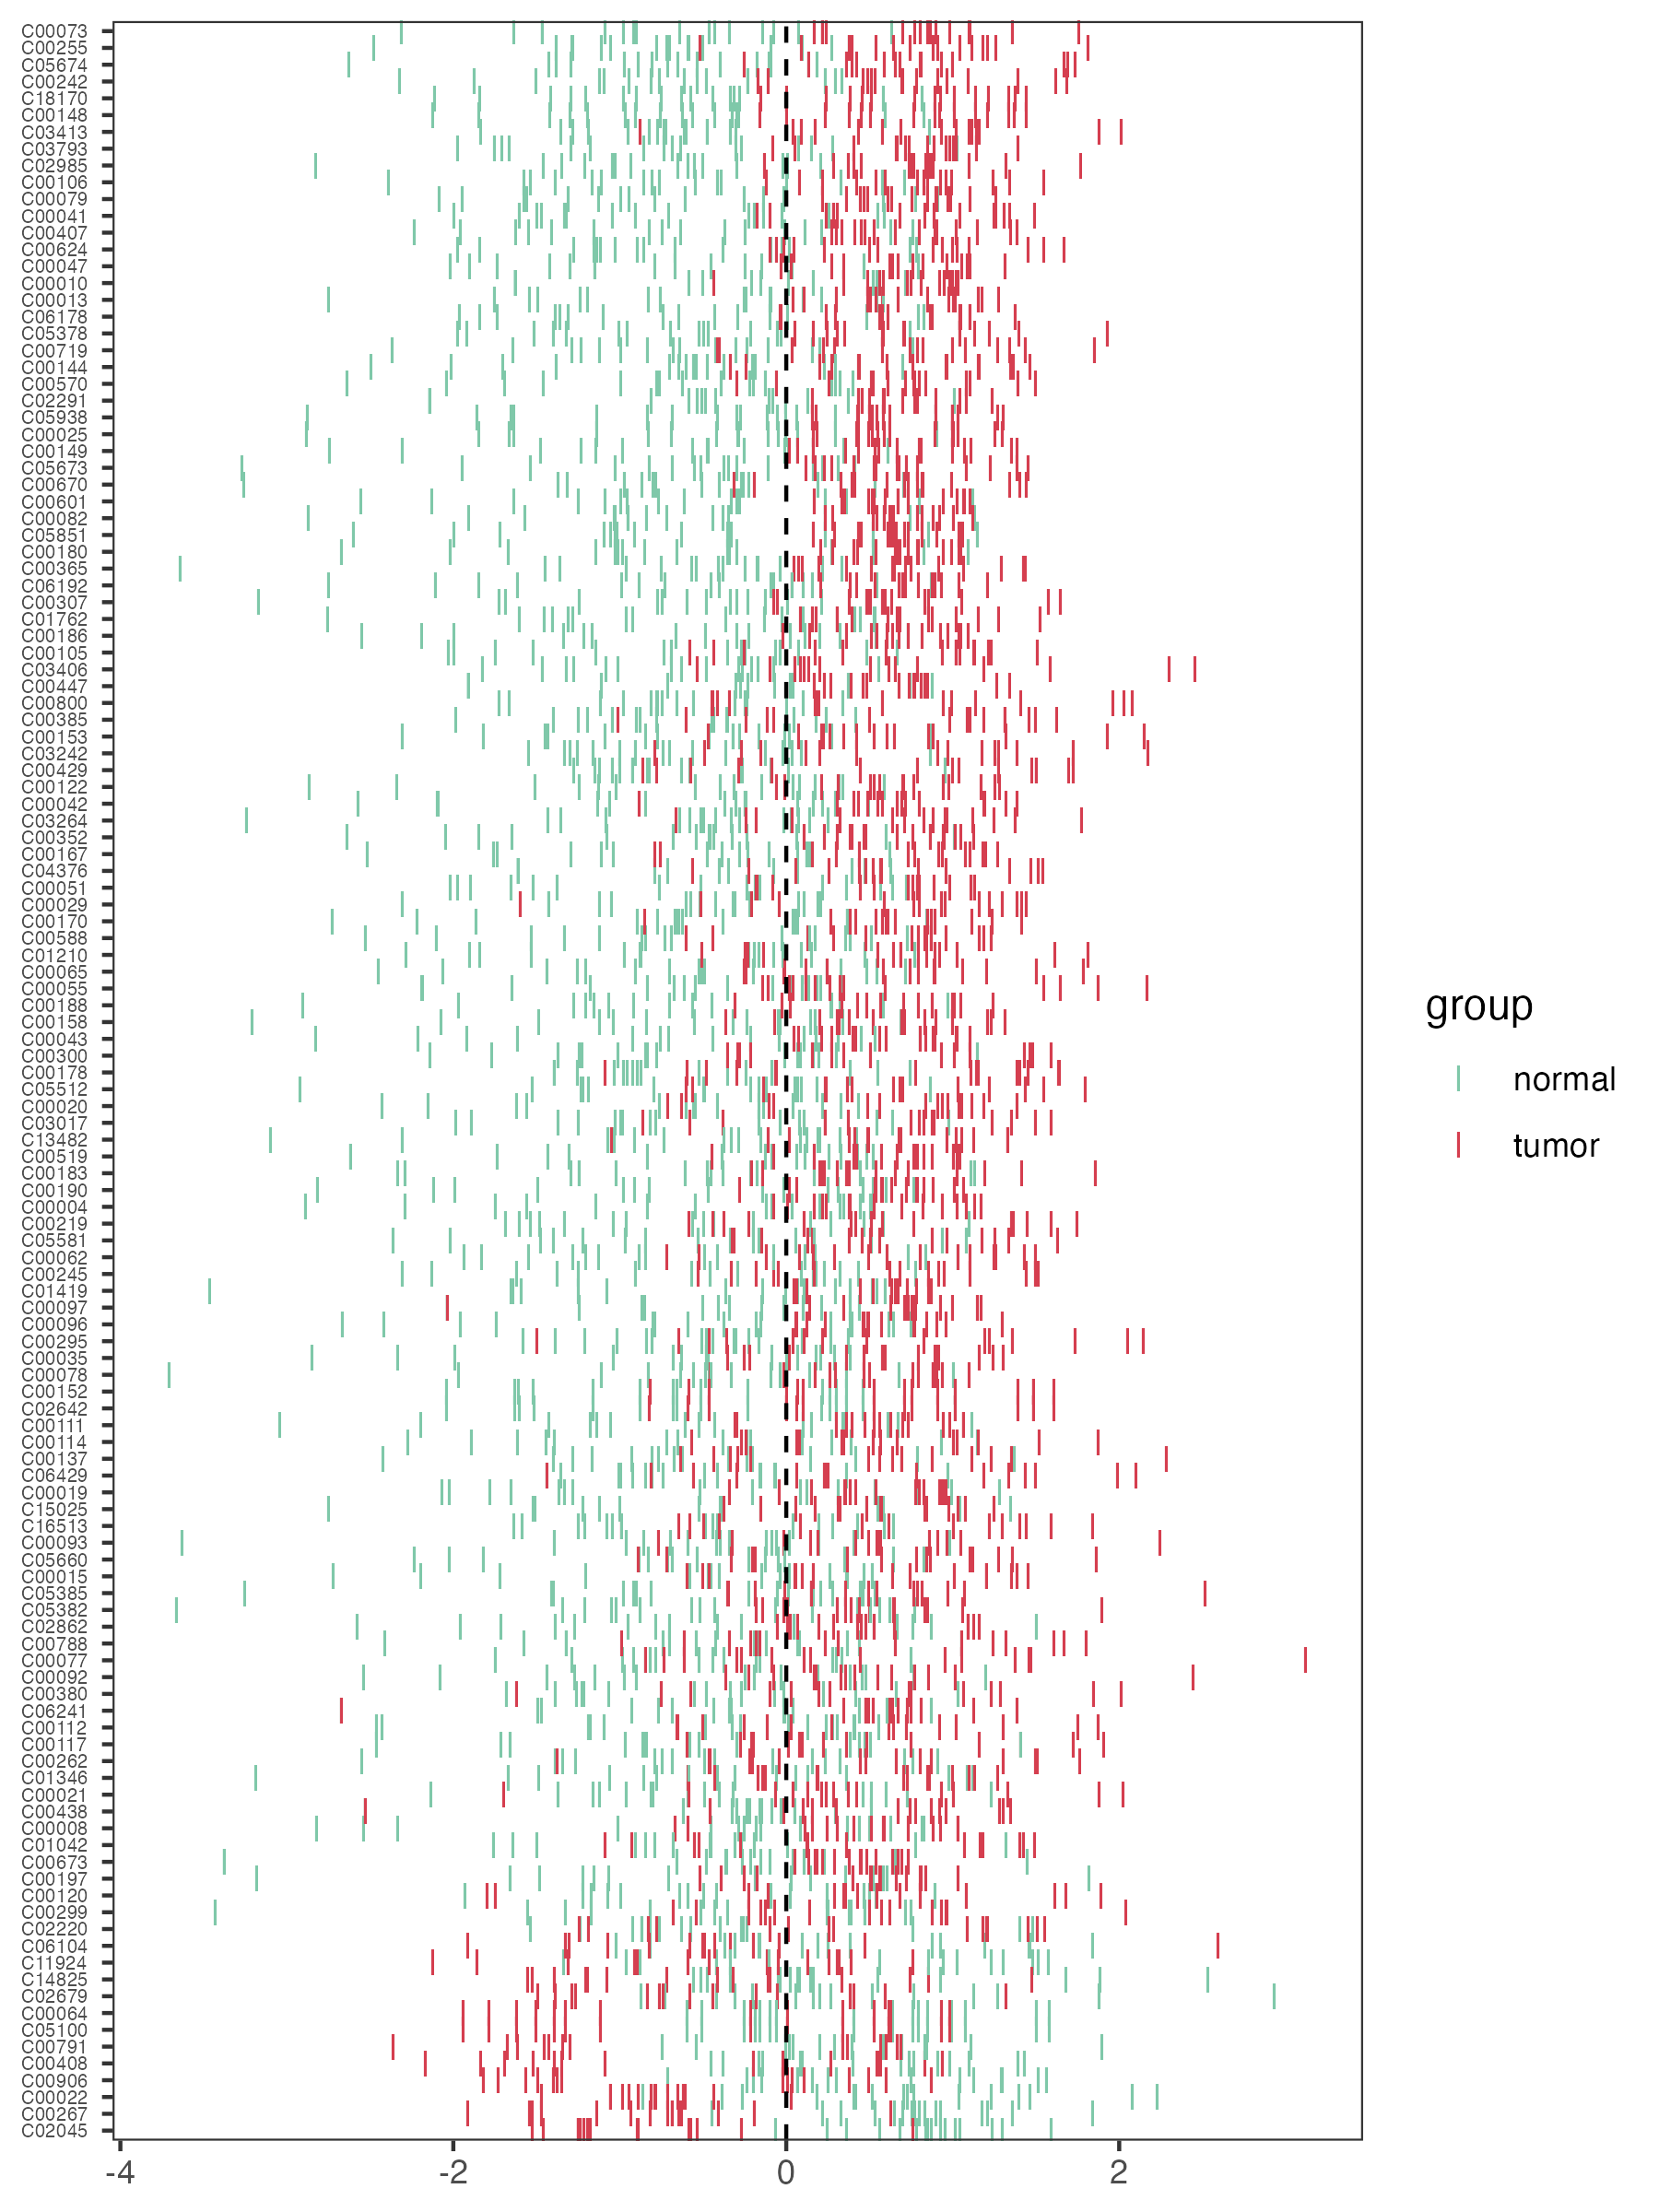
4.3 Pathway analysis
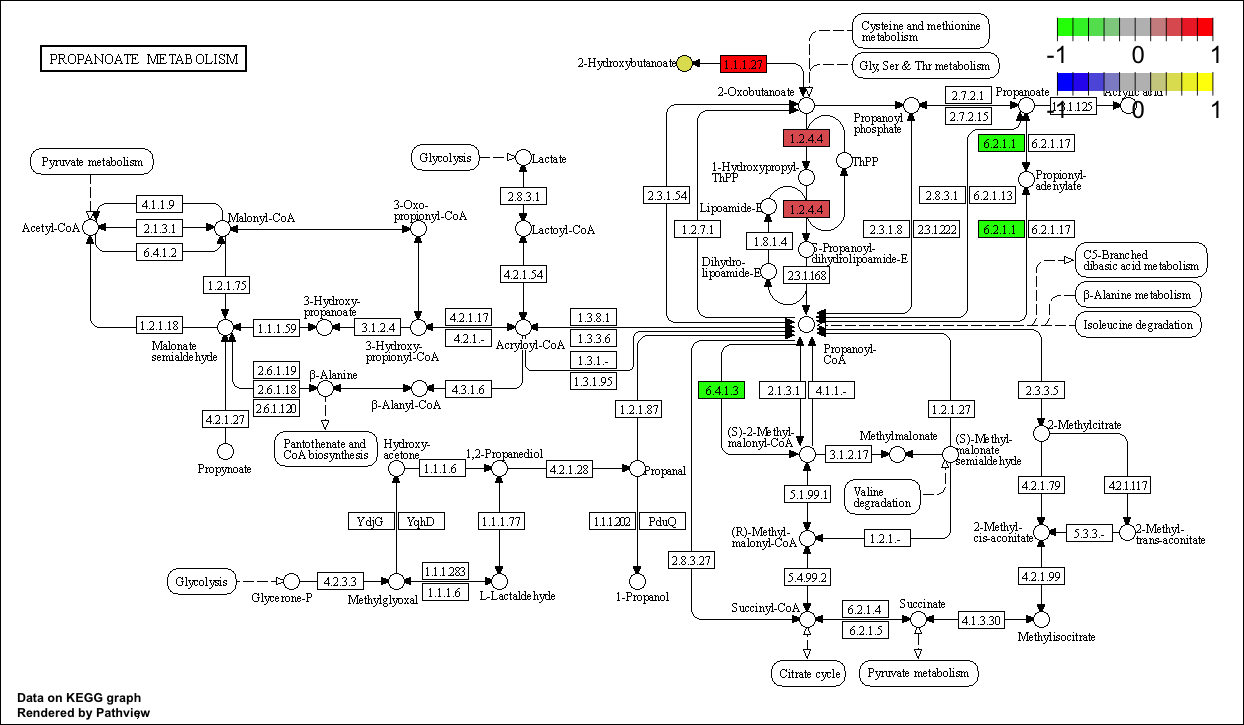
4.3.1 Pathview only metabolite
library(pathview)

kegg_id <- c("C02494","C03665","C01546","C05984","C14088","C00587")
value <- c(-0.3824620,0.1823628,-1.1681486,0.5164899,1.6449798,-0.7340652)
names(value) <- kegg_id
cpd.data <- value

gene_name <- c("LDHA","BCKDHB","PCCA","ACSS1")
gene_value <- c(1,0.5,-1,-1)
names(gene_value) <- gene_name

pPathview(cpd.data,outdir="result/routine/path_meta")
4.4 Clinical analysis
4.4.1 Time series of clinical
The column contains the time, group, clinical index(such as ALT), low and high.
clinical_index[1:5,]
time_series_ALT <- pCliTS(clinical_index,"ALT")
ggsave("result/routine/09.clinical_time_series.pdf",time_series_ALT,height = 4,width = 5)
ggsave("result/routine/09.clinical_time_series.png",time_series_ALT,height = 4,width = 5)
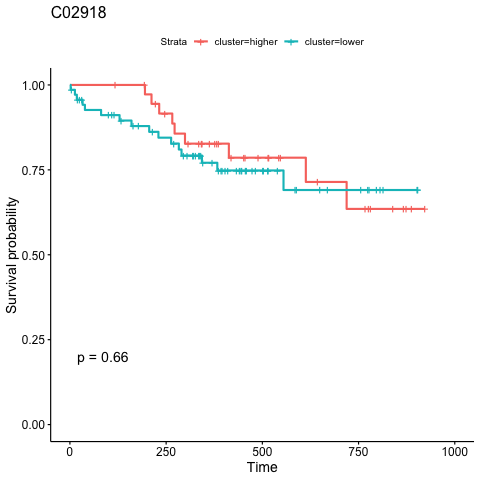
4.4.2 Survival analysis
library(survival)
names(aml)[3] ="group"
p=survCli(aml)
pdf("result/routine/10.survival.pdf",height = 6,width = 6, onefile = F)
p
dev.off()

png("result/routine/10.survival.png",height = 600,width = 600)
p
dev.off()